# Log analysis in CubeCOS

> Learn how to perform log analysis in CubeCOS to diagnose issues, monitor system behavior, and gain visibility into infrastructure events using integrated OpenSearch dashboards.

Learn how to perform log analysis in CubeCOS to diagnose issues, monitor system activity, and gain operational insights into your infrastructure through built-in visualization and querying tools.

The follow sections outlines how to perform log analysis on different components of CubeCOS.

## Instance log analysis {#instance-log-analysis}

1. Navigate to infrastructure management interface via `CubeCOS -> Home -> Integrations -> OpenStack`.
2. Navigate to any instance to begin log analysis through the integrated log viewer available in the instance detail view via `Home -> Compute -> Instances -> Any instance -> Action Logs`.
3. On the `Action Logs` page, select the event you want to investigate and click `Analyze` to view the full event trace for the instance.

## cluster log analysis {#cluster-log-analysis}

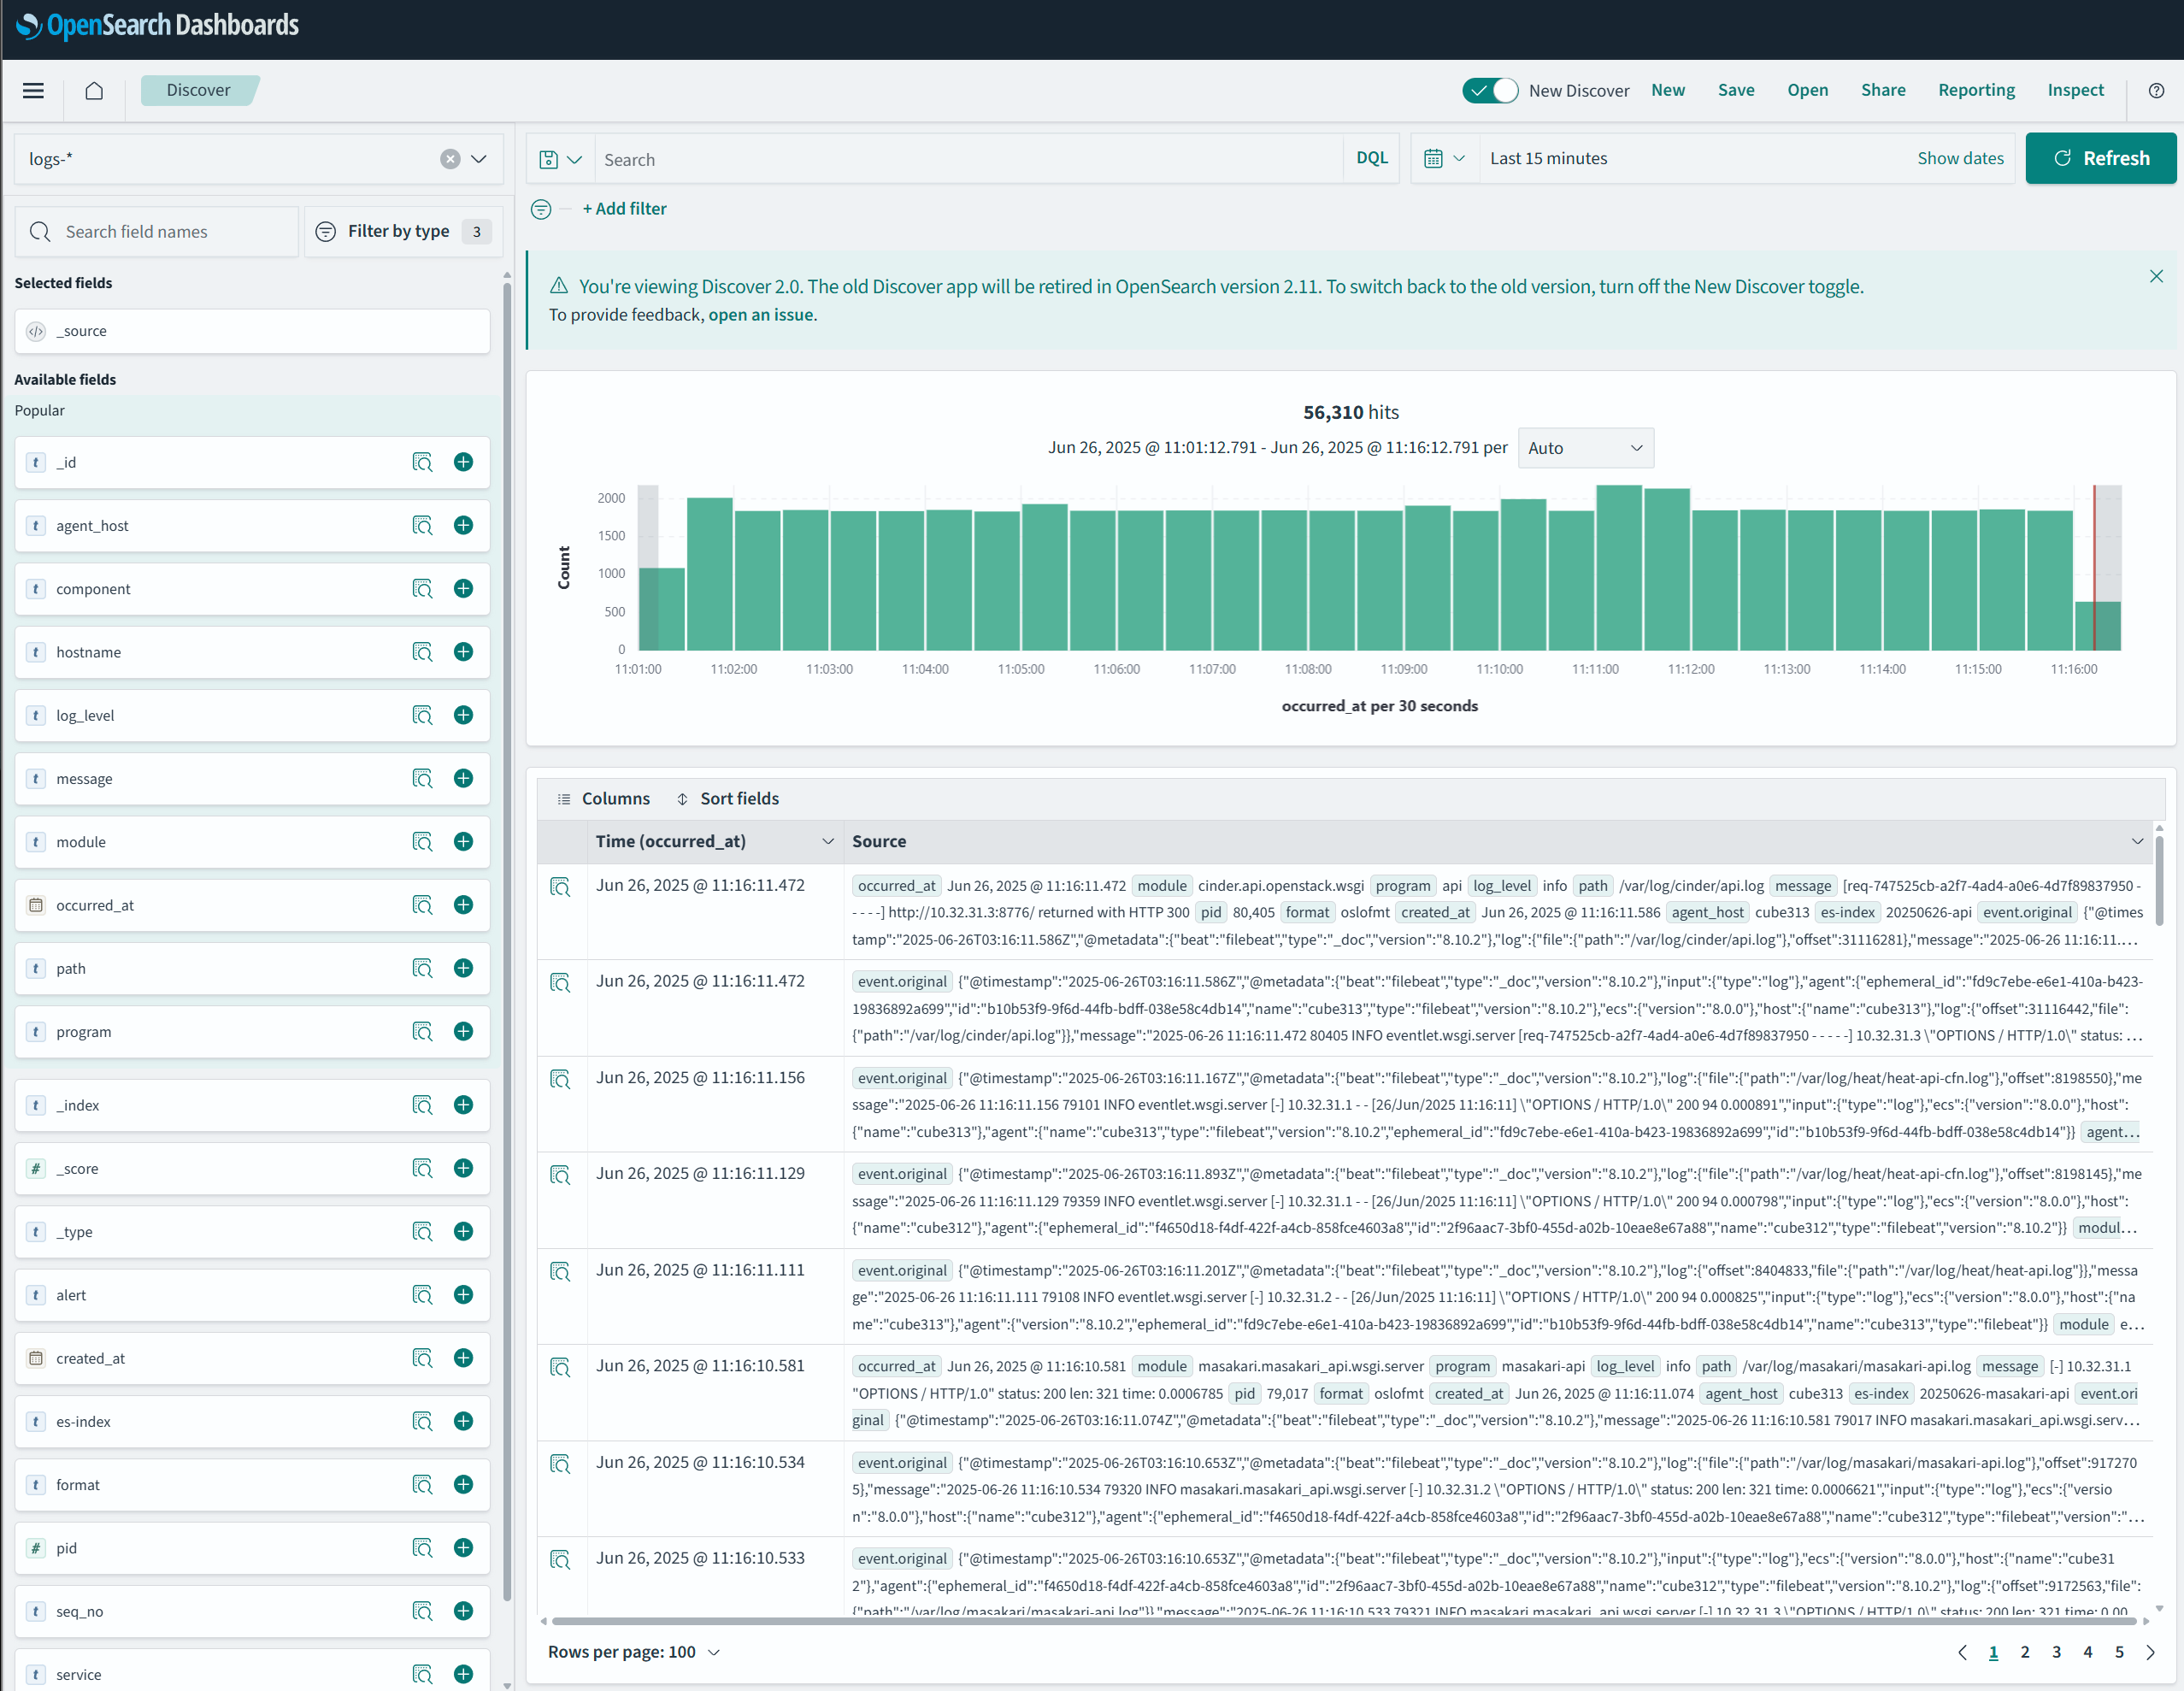
To access the CubeCOS built-in logs visualization and querying tool, navigate to
`http://$VIP:5601/opensearch-dashboards/app/data-explorer/discover`

    ![/assets/iaas/opensearch.png](/assets/iaas/opensearch.png)